

Predicting Bitcoin’s Next Move
How the cryptocurrency’s pre-programmed supply schedule impacts cyclical price swings
If you’re a Bitcoin investor, HODL’r, trader, bull or bear, you can ignore the media headlines and extraneous noise like Fed meetings and tweets from ego maniacal tech billionaires. When considering a good time to buy or take profits, I simply look at Bitcoin’s price movement relative to its previous halving date. That’s because with BTC, the same pattern has played out every four years regardless of politics, macroeconomic conditions or what the Nasdaq is doing. Barring some unforeseen cataclysmic event, that pattern should continue – for a while anyway.
I’ll explain, but first let’s review Bitcoin’s price chart which I’ve annotated below…
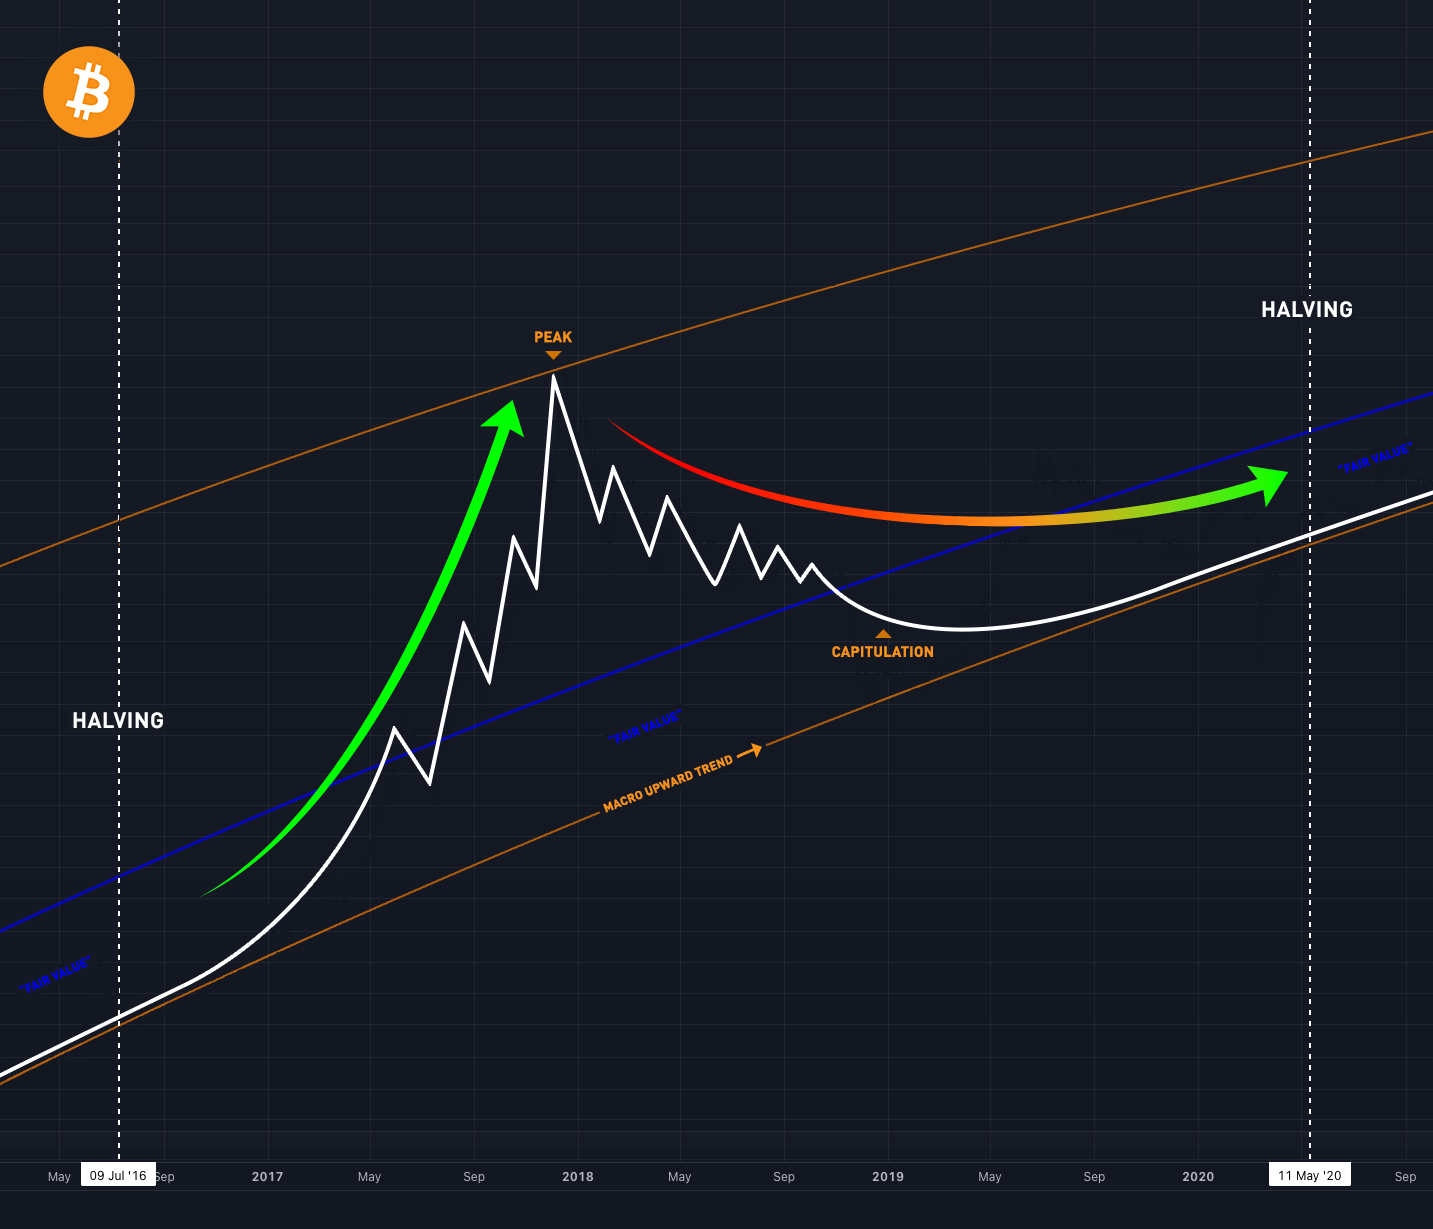
Bitcoin Price Chart (since July 2010). View full screen.
The chart above shows Bitcoin’s price going back to July 2010. Take note of the vertical white dotted lines. These mark Bitcoin’s “halving” dates. Next, study the three groups of waves in between. They are 2013-2015, 2017-2019 and 2021-2023 (we’ll disregard the first set of waves pre-2012 as Bitcoin had just recently launched in 2009). Each one of these three groups of waves represents one complete market cycle. While not identical, the pattern within each cycle is undeniably similar to the preceding one.
Why do the cycles repeat like this? Put simply, it’s supply and demand.
To understand why these cycles occur, and why I believe they will continue to repeat, you need to understand how new bitcoin are created.
When you buy or spend bitcoin, computers (a.k.a. “miners”) on the Bitcoin network compete with each other for the right to add your transaction—along with a bunch of other people’s transactions—to the public Bitcoin ledger. Once a miner adds a new block of transactions to the ledger, that block is then checked and verified by thousands of other computers (a.k.a. validating nodes) on the Bitcoin network. A block of transactions cannot be edited or undone unless a majority of the Bitcoin network agrees to recognize a different set of transactions. Therefore, once a block is successfully validated it is enshrined in Bitcoin’s blockchain and those transactions are considered to be permanently “settled”.
As incentive for doing this important work, a miner that successfully adds a new block of transactions to the blockchain is rewarded with some amount of freshly minted bitcoin. This is the only way that new coins come into circulation.
It’s also important to understand that the rate at which new coins are issued (its supply) is decreasing according to a preprogrammed schedule. That is, every time a set of 210,000 blocks is mined, the amount of coins rewarded to miners—and thus being put into circulation—drops by half. This phenomenon is known as a “halving” and occurs roughly every four years.
Bitcoin’s most recent halving took place on May 11, 2020 when the block reward was cut from 12.5 to 6.25 BTC. The next halving is projected to occur in 2024 when the reward will again be cut in half to 3.125 BTC.
Here’s the fun part…
Bitcoin’s halvings trigger two great forces which impact price:
- Supply Shock
Because the rate of new coins coming onto the market is cut in half while demand remains relatively constant, the Law of Supply and Demand kicks in and price increases. - Fear Of Missing Out
As news spreads about the most recent halving event, a wave of new interest and buying ensues. This increased demand (coupled with the aforementioned supply shock) serves to accelerate upward price movement, which in turn leads to widespread “panic buying”. Of course, the market euphoria eventually culminates with price peaking and then a sharp sell-off.
On a price chart of BTC this phenomenon resembles a tsunami – a crescendo of green candles rising higher and higher. After the peak, on the back side of this massive wave come a series of smaller waves which gradually decrease in length and amplitude.
Expanding on this “tsunami” analogy, the impact of halvings on Bitcoin’s price can be thought of as a big boulder being tossed into a small pond. First, as the boulder enters the water a massive splash is created. This “splash” can be observed in Bitcoin’s bull market bubbles of 2012/13, 2016/17, and 2020/21. Long after the initial wave crests, smaller and smaller ripples continue to radiate outward until eventually the pond is calm again. The calm is only temporary however, until the next halving event occurs and a new “boulder” is tossed into the pond triggering another tsunami.

As a side effect of tossing boulders into a pond one would also observe that the pond’s water level at rest (after the waves subside) increases as each new stone displaces an amount of water equal to its own volume. This is also analogous to Bitcoin’s price, which to-date, has always finished the cycle higher than where it was previously.
For investors (and traders) the trick is being able to identify where you are within one of these four-year cycles. If you can do that, you could enter the trade when Bitcoin’s price is relatively low (ie. pre-halving), and exit during the peak periods (ie. the tsunami waves) for a handsome profit.
Alternatively, if you believe in the long term viability of Bitcoin, as I do, you could simply buy at the lows and HODL, being careful to not buy as much during peak periods.
Will the pattern continue indefinitely?
Probably not. As more people adopt the cryptocurrency and become aware of how it behaves, the increased volume and liquidity will gradually put a damper on wild price swings. Additionally, when Bitcoin finally reaches its supply limit (sometime around the year 2140) no new coins will be mined and there will be no more halving events. That means no more ‘boulders tossed into the pond.’
In conclusion, I believe Bitcoin’s pattern of halving-induced tsunamis IS likely to continue for some time, but over the coming decades these price waves (volatility) will become significantly reduced – one day perhaps even imperceptible. This price stability would make BTC much less useful as a trading tool, but much MORE useful as a currency.
2 Comments
Join the discussion and tell us your opinion.
RELATED VIDEO:
https://youtu.be/eWN5vqwbIxo&t=429s
What Bitcoin Did – July 27, 2022
Editor of Bitcoin Magazine, Pete Rizzo describes Bitcoin cycle theory as “economic coordination”.
RELATED VIDEO:
https://youtu.be/g_aSqVyJ2wE?t=3391
What Bitcoin Did – August 2, 2020
Lyn Alden discusses the relationship between Bitcoin’s adoption, volatility, and future usefulness as a medium of exchange.